IQ score ranges explained
What 85, 100, 115 and 130 mean, and how many people fall in each range.
3 min read
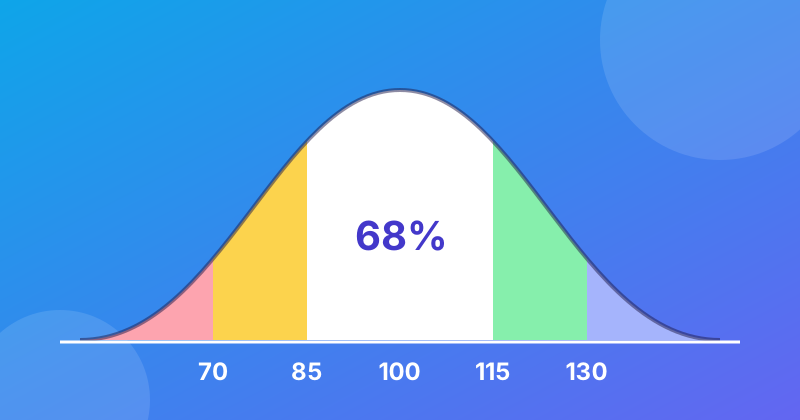
Because IQ scores follow a bell-shaped distribution with an average of 100 and a standard deviation of 15, every score corresponds to a predictable share of the population. Here is how the ranges break down.
| Score | Common label | Share of people |
|---|---|---|
| 130 and above | Very superior / gifted range | about 2% |
| 115 – 129 | Above average | about 14% |
| 85 – 114 | Average | about 68% |
| 70 – 84 | Below average | about 14% |
| Below 70 | Well below average | about 2% |
Labels differ between test publishers, and many psychologists avoid labels altogether, preferring to report the percentile. The percentages are what stay constant.
Score versus percentile
A percentile tells you what share of people scored lower than you. Some useful reference points:
- 100 — the 50th percentile, exactly in the middle.
- 110 — about the 75th percentile.
- 120 — about the 91st percentile.
- 130 — about the 98th percentile. This is the usual cut-off for high-IQ societies such as Mensa.
- 145 — about the 99.9th percentile, roughly 1 person in 1,000.
Notice that the steps are not even. Going from 100 to 110 passes a quarter of the population, while going from 130 to 140 passes less than 2%. Near the extremes, a few points mean a lot in percentile terms — and a single lucky or unlucky answer moves the score more.
Why our results stop at 55 and 145
With 20 questions, a test can only separate people reliably within a certain band. Beyond about three standard deviations from the mean, the difference between one score and the next comes down to one or two answers, so we cap the displayed result at 55 and 145 rather than show precision we do not have.
Read your result as a range
Every test, including clinical ones, has measurement error. On a short online test, treat your score as the middle of a range of roughly ±8 points. If you scored 118, a fair reading is "somewhere around 110 to 126, most likely above average." Taking the test again soon after will usually give a slightly higher score, because the puzzles are now familiar.